
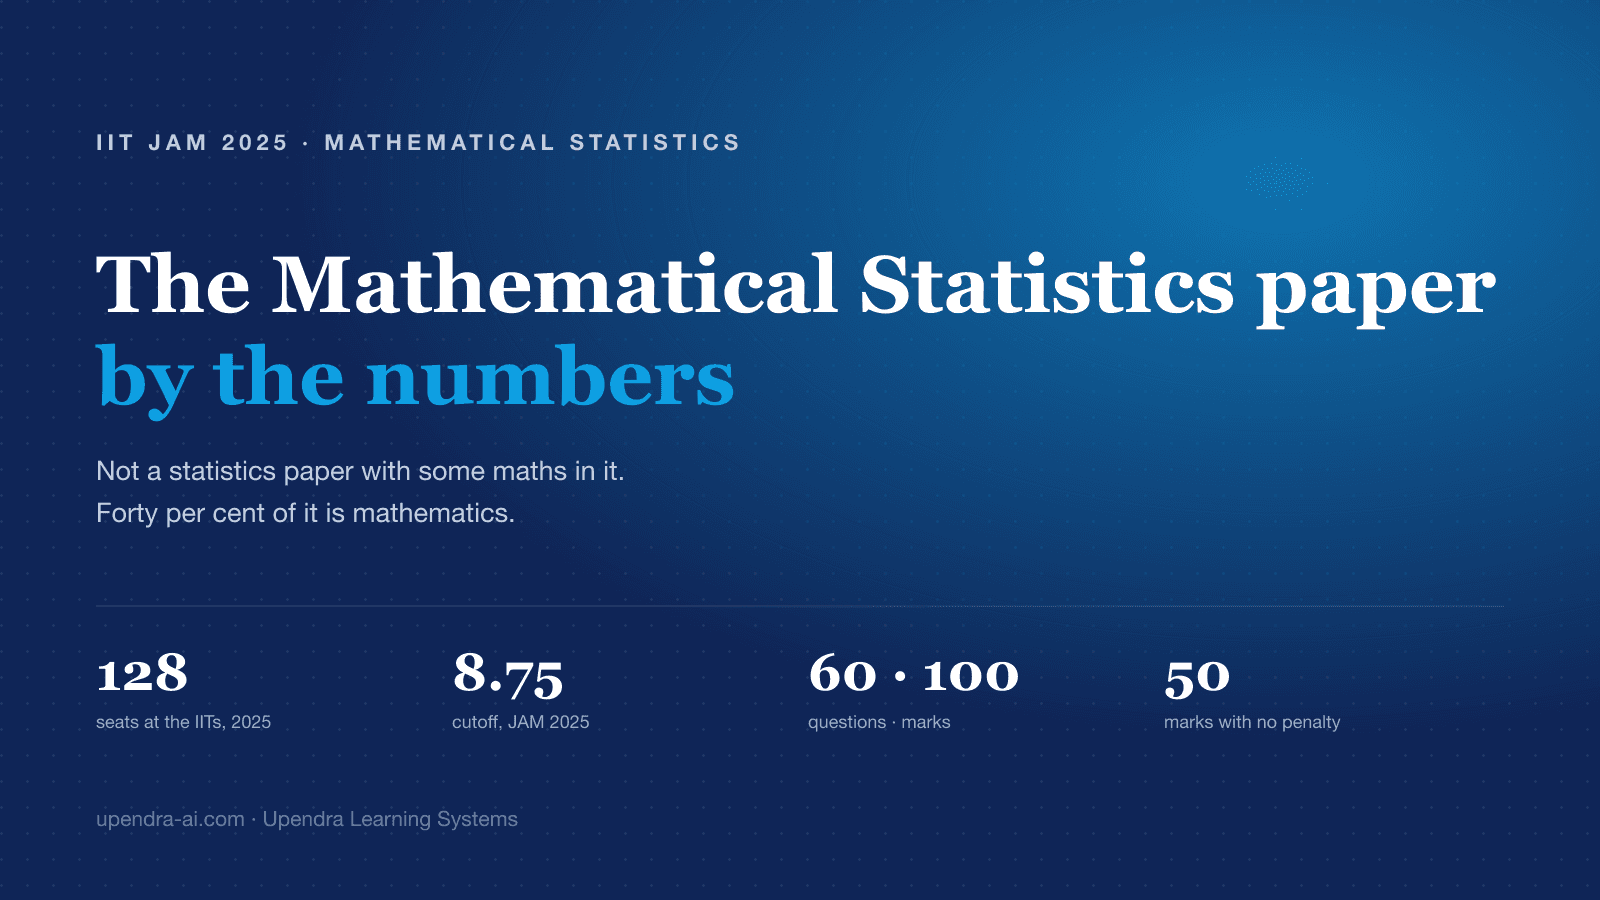
Mathematical Statistics is the paper most often misjudged before anyone opens the syllabus. The name suggests a statistics paper. It is not: 40% of it is mathematics, by design and by the official syllabus, and that split decides who clears it more often than any single topic does.
It is also one of the smallest papers — 128 seats across the IITs — and in 2025 it recorded the lowest qualifying cutoff of all seven. This article is about what those facts mean together.
If you have not sat IIT JAM before, the general guide to the exam covers the rules that apply to all seven papers — the marking scheme, eligibility and how admission actually works. This page assumes them.
Which year is this data from? Every figure here is from the IIT JAM 2025 cycle — the 2025 seat matrix, and the qualifying cutoffs declared with the 2025 result — with the cutoff series running back to JAM 2021. The exam pattern, marking scheme and eligibility rules are as they stand now.
This page is updated after each year’s result rather than replaced, so the older figures stay here beside the new ones. A single year tells you where the bar was; five years tell you how far it moves, which is the more useful thing to know while you are preparing.
1. Where the MS paper sits
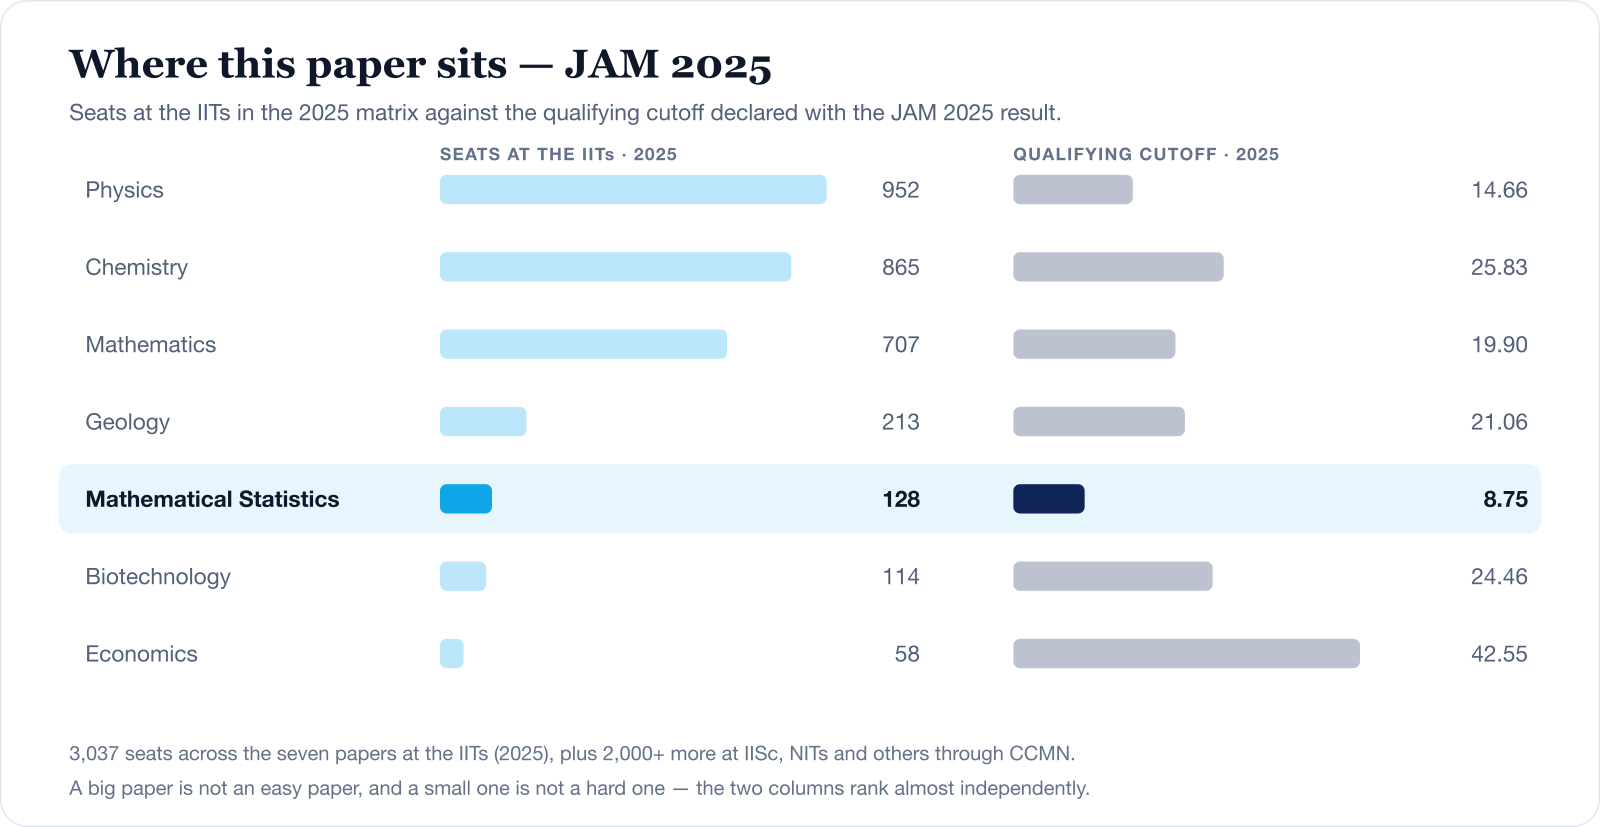
Two things stand out, and they pull in opposite directions. MS had the lowest qualifying cutoff of the seven papers in 2025, at 8.75 out of 100 — which tells you the paper was hard, not that it was easy to get into. And it has one of the smallest seat counts, which means qualifying and being admitted are further apart here than in the large papers.
A low cutoff is a measure of how few marks the paper allowed, not of how little competition there is. With 128 seats, the rank you need is decided by how many people cleared it, not by where the bar was set.
2. What the paper is made of
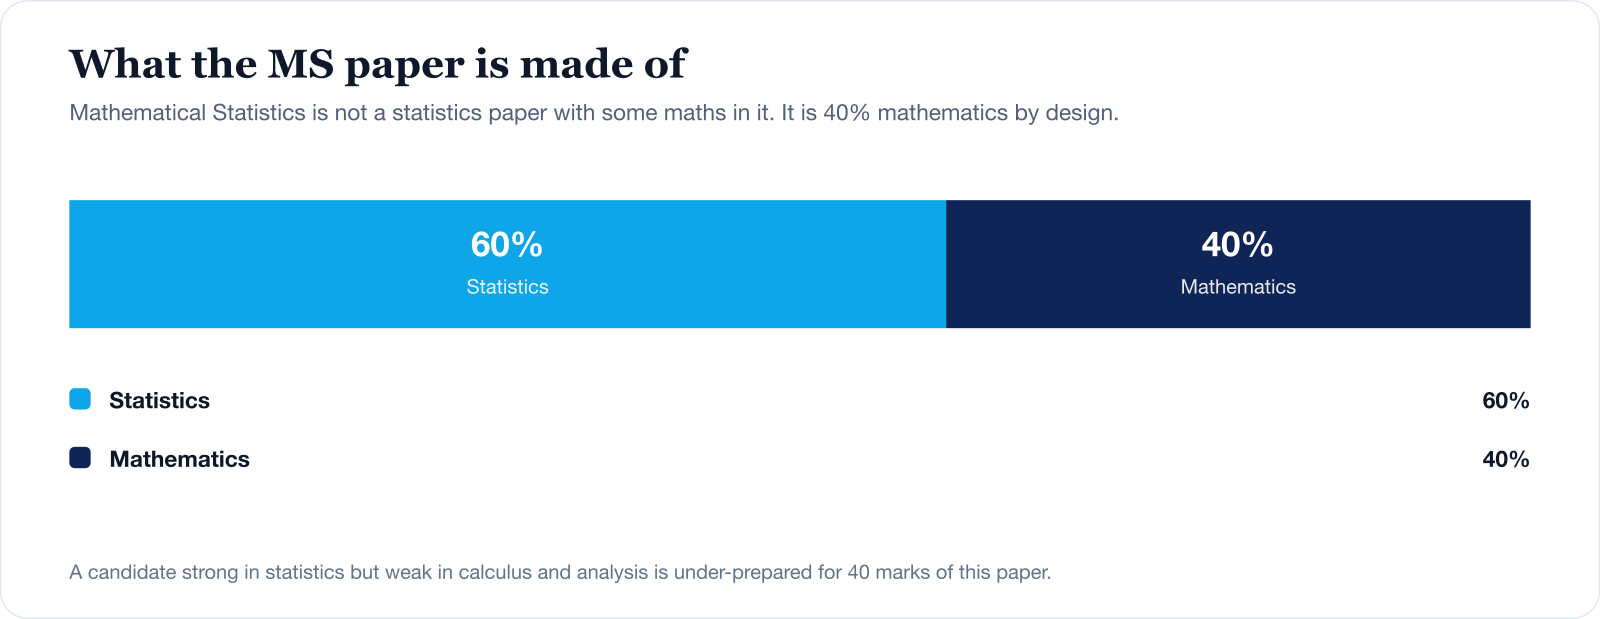
The 40/60 split is the single most important fact about this paper. The mathematics 40% is not incidental background — it is sequences and series, differential calculus including limits, continuity, differentiability, Rolle’s theorem, mean value theorems and Taylor’s theorem, and integral calculus including double and triple integrals.
The statistics 60% covers probability, univariate and multivariate distributions, limit theorems, sampling distributions, estimation and its methods, and testing of hypotheses.
A candidate who is comfortable with distributions and estimation but shaky on calculus and analysis is not slightly under-prepared here. They are under-prepared for forty marks of a hundred-mark paper, and no amount of extra statistics will recover those.
3. The paper itself
Every JAM paper has the same three sections, and the difference between them decides more of your score than most candidates realise.
| Section | Type | Questions | Marks | Negative marking |
| A | Multiple choice, one correct | 30 | 50 | −1/3 and −2/3 |
| B | Multiple select, one or more correct | 10 | 20 | None |
| C | Numerical answer, type the value | 20 | 30 | None |
Fifty of the hundred marks carry no penalty for a wrong answer. In Sections B and C a blank and a wrong answer score identically, so there is no defensive reason to leave a numerical question untouched. Section A is the only place a guess costs you anything — and a wrong 2-mark MCQ swings 2⅔ marks against you once you count the marks you did not get.
Section B has one more rule worth stating plainly: there is no partial credit. Select two of three correct options and you score zero, exactly as if you had selected nothing.
4. What five years of cutoffs say
| JAM year | General | OBC-NCL / EWS | SC / ST / PwD |
| JAM 2021 | 22.07 | 19.86 | 11.04 |
| JAM 2022 | 16.39 | 14.75 | 8.20 |
| JAM 2023 | 14.61 | 13.15 | 7.30 |
| JAM 2024 | 23.03 | 20.73 | 11.52 |
| JAM 2025 | 8.75 | 7.88 | 4.38 |
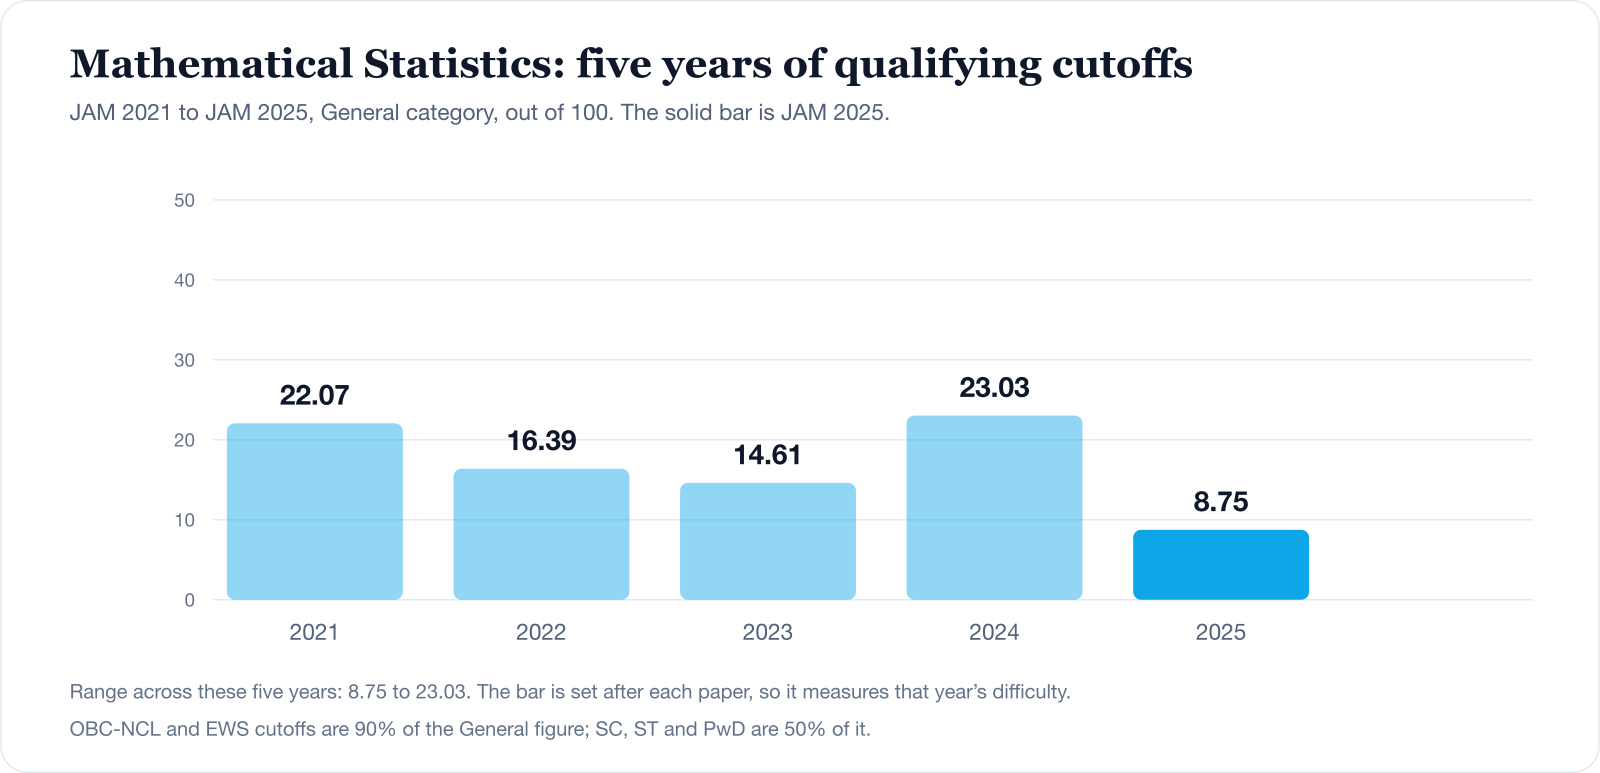
The General column is the figure declared with each year’s result. The other two are not set separately — JAM fixes them at 90% and 50% of the General cutoff, so they follow from it exactly, and you can always derive your own category’s number that way.
Read the series rather than the latest bar. Over these five years the Mathematical Statistics cutoff has ranged from 8.75 to 23.03 out of 100, and the reason is that the bar is set after the paper — it measures how that year’s cohort scored. A cutoff that falls means the paper was harder, not that fewer people wanted the seats; a cutoff that rises means it was kinder.
That is also why last year’s figure is a poor target. It is a description of a paper you will not sit.
And in every year, this is the bar to appear on the merit list — not the bar for a seat. Admission is decided later by All India Rank against each programme’s closing rank, which is published during counselling.
5. Who may sit it
| Rule | What it says |
| Qualifying degree | A bachelor’s degree. Final-year students may apply and produce it at admission. |
| Minimum marks to apply | The old percentage cut-off has been relaxed — a pass in the degree is what is needed to appear. |
| Age limit | None. |
| Attempts | No limit. |
| Degree subject | Need not match the paper you sit — but the programme you apply to sets its own subject requirements. |
That last row is the one to act on. Sitting the paper is open to anybody with a degree; being admitted to a specific M.Sc. programme is not. Each institute publishes a minimum educational qualification for each programme — which subjects you must have studied, and at what level — and those are the lists to read before you register, not after your result.
6. What the paper is asking for
- Treat it as a mathematics paper that also tests statistics. Forty marks of calculus and analysis are not a warm-up section.
- Expect the cutoff to move. It has ranged from 8.75 to 23.03 across JAM 2021 to 2025. Prepare for the paper, not for a number.
- Attempt everything in Sections B and C. Half the paper carries no penalty for being wrong.
- Watch the seat count. With 128 seats, the gap between qualifying and getting admitted is wider here than in Physics or Chemistry.
Topic-by-topic preparation and attempt strategy are separate articles. This one is the map.
Quick answers
Frequently asked
How much of the IIT JAM MS paper is mathematics?
40%, by the official syllabus — sequences and series, differential calculus including mean value and Taylor’s theorems, and integral calculus including double and triple integrals. The remaining 60% is statistics.
How many seats does Mathematical Statistics have?
128 across the IITs in the 2025 matrix — one of the smallest of the seven papers, out of 3,037 in total.
What was the IIT JAM MS cutoff?
The General-category figure was 8.75 in 2025, 23.03 in 2024 and 14.61 in 2023 — proportionally the sharpest movement of any JAM paper over that period.
Does a low cutoff mean Mathematical Statistics is easy to get into?
No. The cutoff is set after the paper and measures how few marks it allowed. With only 128 seats, the rank you need for admission is decided by how many people cleared it, not by where the bar was set.
Is there negative marking in this IIT JAM paper?
Only in Section A. A wrong 1-mark MCQ costs one-third of a mark and a wrong 2-mark MCQ costs two-thirds. Sections B and C — 50 of the 100 marks between them — carry no negative marking at all, so a blank and a wrong answer score exactly the same.
Is there partial credit in Section B?
No. You must select every correct option and no incorrect one. Selecting two of three correct options scores zero, exactly as if you had selected nothing.
Does my bachelor’s degree have to be in this subject?
Not to sit the paper — there is no restriction on which paper you register for. But each M.Sc. programme sets its own minimum educational qualification for admission, so check the requirements for the specific programmes you want before you register.
How are the category cutoffs decided?
By a fixed ratio off the General figure — OBC-NCL and EWS are 90% of it, and SC, ST and PwD are 50% of it. You can always derive your own category’s number from the General one.
Keep reading